Metrics dashboard
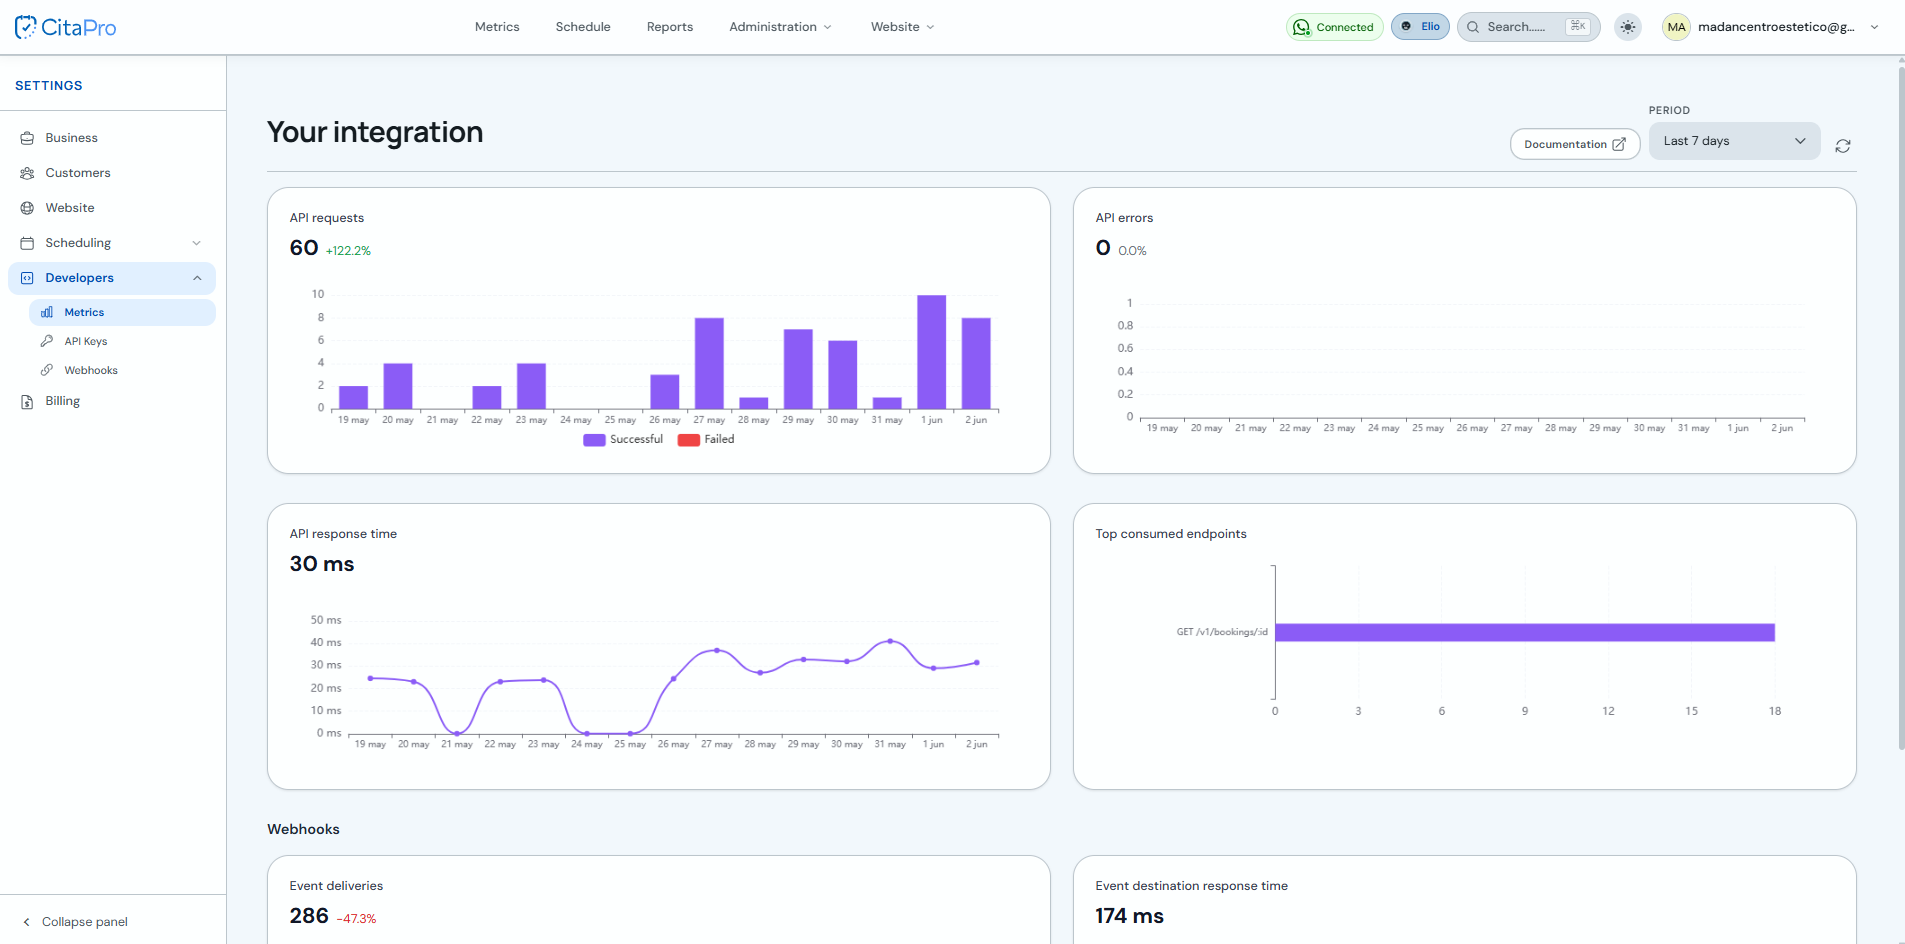
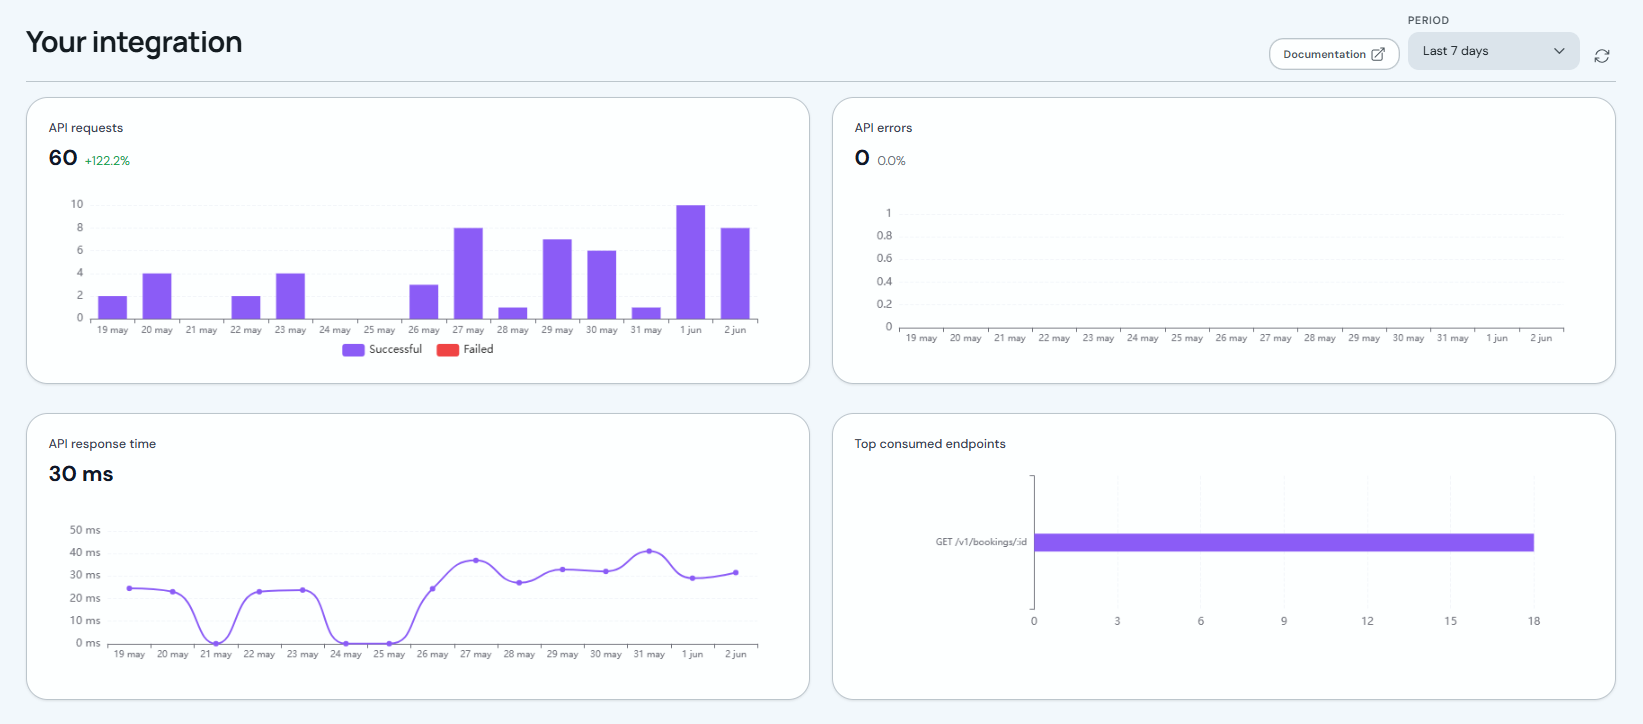
The "Your integration" panel summarizes API usage and webhook health. You can filter by period (e.g. last 7 days) and open the documentation from the same screen.
-
Go to Settings → Developers → Metrics. For more information, visit CitaPro Developers . At the top you will see the "Your integration" summary, the period selector and documentation. API and Webhook metrics are grouped below.
-
In the API section check: "API Requests" (total and successful vs failed bars), "API Errors" (failures in the period), "API Response Time" (latency in ms) and "Most Consumed Endpoints" (which routes you call most).
-
Under Webhooks review "Event Deliveries" (successful and failed sends per day) and "Event destination response time" (how long your server takes to respond, in ms). If failures or latency rise, check your URL and endpoint availability.
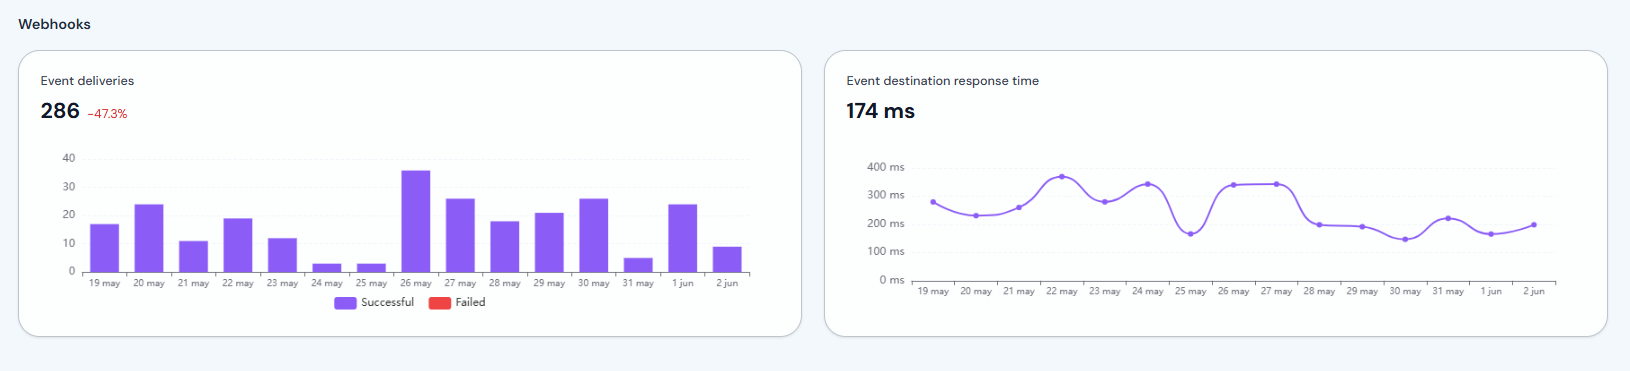
If API errors or failed deliveries increase, verify your API key first and ensure your server returns 2xx status codes for webhooks.